 BetTennis
 Advanced Tennis Betting Strategies: Systems for Long-Term Profitability
 Available in US
Most tennis bettors lose money. That’s not pessimism, it’s math. The juice built into every bet, combined with emotional decision-making and incomplete analysis, grinds down bankrolls over time. The bettors who actually make money aren’t lucky. They’re not psychic. They’re systematic. They have frameworks, rules, and processes they follow religiously regardless of short-term results.
Building a profitable tennis betting system isn’t about finding one magic strategy that prints money forever. Markets adapt. Edges erode. What worked two years ago might be worthless today. Instead, it’s about developing a portfolio of strategic approaches, understanding when each applies, and having the discipline to execute even when variance punches you in the face repeatedly.
This guide walks through proven systems that professional bettors use to extract long-term value from tennis markets. Some of these strategies contradict each other. That’s intentional. There’s no single “right” way to bet tennis profitably. The key is understanding the logic behind each system, recognizing when market conditions favor it, and adapting as necessary. If you’re looking for simple answers or get-rich-quick schemes, you won’t find them here. What you’ll find is honest, actionable strategic thinking that works when applied correctly over large samples.
The Favorite-Based Value System
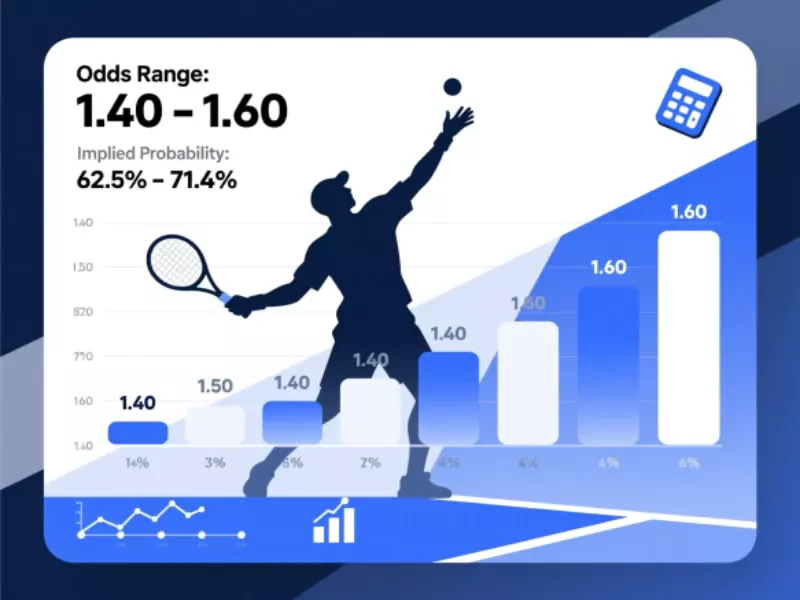
The favorite-based value system targets favorites priced in the sweet spot between odds of 1.40 and 1.60, roughly -250 to -167 in American odds. This range offers the optimal balance between win probability and payout. The logic is straightforward: favorites in tennis win frequently enough that stringing together multiple winners is realistic, but the odds are good enough that you’re getting paid adequately for the risk.
The system requires rigorous pre-match analysis. You’re not backing every favorite in this odds range. You’re identifying favorites where the odds understate their actual winning probability. Maybe a player is -150 but your analysis suggests they should be -200. That gap is value, and that’s what you’re hunting.
Start by evaluating recent form with granularity beyond just win-loss records. A player might be 4-1 in their last five matches, which looks solid. But if those four wins came against players ranked outside the top one hundred and the loss was a straight-sets beatdown from a quality opponent, that form isn’t as impressive as the record suggests. Compare that to a player who’s 3-2 but those wins came against top-thirty opponents in competitive three-set matches. The 3-2 player might actually be in better form.
Surface specialization intersects perfectly with this system. A clay court specialist priced at -140 on clay might have true odds closer to -200 when you account for their surface advantage. The market knows surface matters but doesn’t weight it aggressively enough for mid-tier players. This creates systematic opportunities in the -140 to -160 range.
Head-to-head history matters but only with proper context. If your favorite is 4-0 against their opponent, great. But check when those matches occurred, on what surfaces, and what the scorelines were. A 4-0 record with all matches going three sets on a different surface two years ago doesn’t predict a straight-sets victory on today’s surface. Weight recent head-to-head meetings on the same surface most heavily.
Match importance and player motivation factor into favorite value. A top-twenty player entering a small ATP 250 event might be looking ahead to next week’s Masters 1000 tournament. They’re the favorite on paper but not fully motivated. Their unseeded opponent is fighting for ranking points and fully engaged. The favorite’s true odds might be worse than the market price suggests because motivation isn’t being properly discounted.
The catch-up or Martingale component is tempting but dangerous. Some bettors use this system and double their stake after losses to recover quickly. This works until it doesn’t. A string of four or five losses, which absolutely happens even when betting solid favorites, can destroy your bankroll if you’re doubling stakes. Flat staking is safer. Bet one unit on each qualifying favorite and let volume and edge do the work over time.
Live betting enhances this system significantly. If your pre-match favorite at -150 drops the first set, their live odds might balloon to +180 or +200. If your analysis still suggests they’re the better player and the first set loss was variance rather than indication of true form, you can bet them live at much better odds than pre-match. This requires watching matches or at least monitoring them closely, but the value can be substantial.
Record keeping is non-negotiable with any system but especially this one. Track every bet with the odds, the player, the surface, the tournament, and the outcome. Over time, patterns emerge. Maybe you’re profitable backing favorites on clay but losing money on grass. Maybe you’re great at ATP matches but terrible at WTA. You can’t improve without data showing you where your process works and where it fails.
The psychological challenge with favorite-based systems is surviving losing streaks. You’ll have stretches where favorites lose three, four, five matches in a row. It feels terrible. Your bankroll is bleeding. The temptation to abandon the system is overwhelming. This is where discipline separates winners from losers. If your process is sound and your sample size is still small, trust the process. Variance evens out over hundreds of bets, not dozens.
The Service Game Exploitation Strategy

Service games are the heartbeat of tennis matches. The server has a natural advantage, and this advantage varies dramatically by player, surface, and conditions. Exploiting service game dynamics creates edges in both pre-match and live betting markets.
The foundation is understanding serve hold percentages. Professional players hold serve anywhere from sixty percent to ninety percent of their service games depending on ability, surface, and opponent. A player who holds serve eighty-five percent of the time on grass is incredibly difficult to beat because break opportunities are rare. A player who holds serve sixty-five percent of the time is vulnerable even against inferior opponents.
Surface dramatically affects hold percentages. On grass, even mediocre servers hold more frequently because the fast, low bounce favors serving. On clay, hold percentages drop because returners have time to track down serves and extend rallies. Hard courts sit between these extremes but vary by venue.
The strategic application is identifying mismatches in serve strength. When a player who holds serve eighty percent of the time faces an opponent who holds serve seventy percent, the higher hold percentage player has a measurable edge. That edge might not be fully reflected in the moneyline odds if the lower hold percentage player is ranked higher or has better overall results.
This becomes even more pronounced in specific serve game betting markets. Some sportsbooks offer markets on individual service games during live betting. Will the server hold this game? The odds might be -200 on a player who historically holds serve eighty-five percent of the time, which implies roughly 66.7 percent probability. But eighty-five percent probability should be closer to -566. That’s a massive value gap.
The challenge is these markets have lower limits and you need to be watching the match to bet them effectively. But if you’ve built a database of serve hold percentages by surface for players you follow, you can exploit these markets repeatedly when they appear.
Break point conversion rates matter as much as hold percentages. A player might face five break points per match but only convert one. Another player faces three break points per match but converts two. The second player is more dangerous despite facing fewer break opportunities because they capitalize when chances arise.
Pre-match, you can use serve statistics to inform spread betting and totals. Two players with high hold percentages likely means fewer total games because breaks are rare and sets go to tiebreakers at 6-6. Two players with low hold percentages means more breaks, longer games with multiple deuces, and higher totals.
Live betting on service games requires understanding momentum and pressure. A player serving at 5-4 in the third set to stay in the match faces immense pressure. Their normal eighty percent hold rate might drop to sixty-five percent in this situation. Conversely, a player serving at 5-3 to close out a match might actually have a higher hold percentage than normal because they’re confident and their opponent is deflating.
Weather impacts serve games measurably. Wind disrupts ball toss and serve rhythm. A player with a high ball toss on serve struggles more in wind than a player with compact service motion. Hot conditions fatigue players, and serve speed drops as matches progress, making holds harder. Cold conditions tighten muscles and affect timing. Monitoring weather and understanding how it affects specific players’ serves creates edges.
The left-handed serve angle is real and exploitable. Most players spend careers returning against right-handed serves. When they face a lefty, especially on grass where serves dominate, the unfamiliar angles create problems. Check any player’s record against left-handed opponents. Some players have shocking splits. A player might hold serve eighty percent against righties but only seventy percent against lefties. That’s a significant edge when betting on the left-handed opponent.
First serve percentage is a leading indicator of hold percentage. Players who get seventy percent first serves in hold more frequently than players getting fifty-five percent first serves in. During live betting, if you notice a player’s first serve percentage dropping significantly below their average, their hold percentage will likely drop too. This creates opportunities to bet against them holding or bet on their opponent breaking.
The Third Set Comeback System

The third set comeback system exploits a predictable market overreaction. After one player dominates the first set, the betting market shifts dramatically in their favor even though the match is far from over. This creates value opportunities on the player who lost the first set, assuming you believe the match is actually competitive.
The setup requires two players of roughly similar ability. If a massive favorite is demolishing an overmatched opponent, this system doesn’t apply. But when two players separated by ten or fifteen ranking spots meet, and the market has them priced close pre-match, they’re probably close in actual ability.
When the higher-ranked or favored player wins the first set 6-1 or 6-2, the betting market assumes dominance. A match that opened with the favorite at -150 suddenly sees odds shift to -400 or -500. The underdog’s odds balloon from +130 to +300 or +350. The market is essentially declaring the match over based on one set.
Sometimes the market is right. The favorite genuinely is dominating and the match is effectively finished. But often, especially on slower surfaces like clay, the first set doesn’t tell the complete story. Maybe the underdog started cold. Maybe they got broken early and couldn’t recover psychologically in that set. Maybe a few bounces went against them. The scoreline looks brutal but the actual level of play wasn’t as lopsided as 6-1 suggests.
The key is watching the match or at least monitoring live statistics. If the underdog lost the first set 6-1 but their serve statistics are reasonable and they’re not making tons of unforced errors, the set score might not reflect the true gap between the players. That’s when you strike. Bet the underdog at now-inflated odds or bet on the match going to three sets if that market is available.
The second set provides confirmation. If the underdog immediately drops serve again at the start of the second set, abort. They’re genuinely getting dominated and the market was correct. But if they hold serve comfortably or even break serve early in the second set, it confirms the match is competitive and the first set was an outlier. Double down if odds are still favorable.
This system works better on clay than other surfaces. Clay allows for comebacks because momentum swings are possible through consistency and grinding. On grass where serves dominate, coming back from a set down is harder because break opportunities are rare. Hard courts sit in the middle depending on court speed.
The psychological element matters significantly. Some players fold after dropping a tough first set. Others get angry and elevate their game. Knowing which players respond well to adversity and which ones crumble helps you identify good spots for this system. A player with a history of three-set comebacks is a better candidate than a player who typically folds after dropping the first set.
Match context influences comeback probability. Early rounds of smaller tournaments see more comebacks because players are still finding form. Later rounds of majors see fewer comebacks because the intensity is higher and players are sharper. Adjust your application of this system based on tournament stage and importance.
The risk management aspect requires strict rules. Set a maximum odds threshold for deploying this system. Maybe you’ll bet comebacks up to +350 but no higher. Beyond +350, even if you believe the match is competitive, the odds are suggesting the comeback probability is low enough that it’s not value. Having these hard cutoffs prevents emotional betting on long shots.
Hedge opportunities emerge naturally with this system. If your underdog comeback bet wins the second set and forces a third, you can hedge by betting the favorite at now-shortened odds for the third set. Structure it correctly and you guarantee profit regardless of who wins the third. This is especially useful in high-variance situations where you’ve captured great value on the comeback but aren’t confident about the third set.
The Qualifier and Match-Sharp Advantage
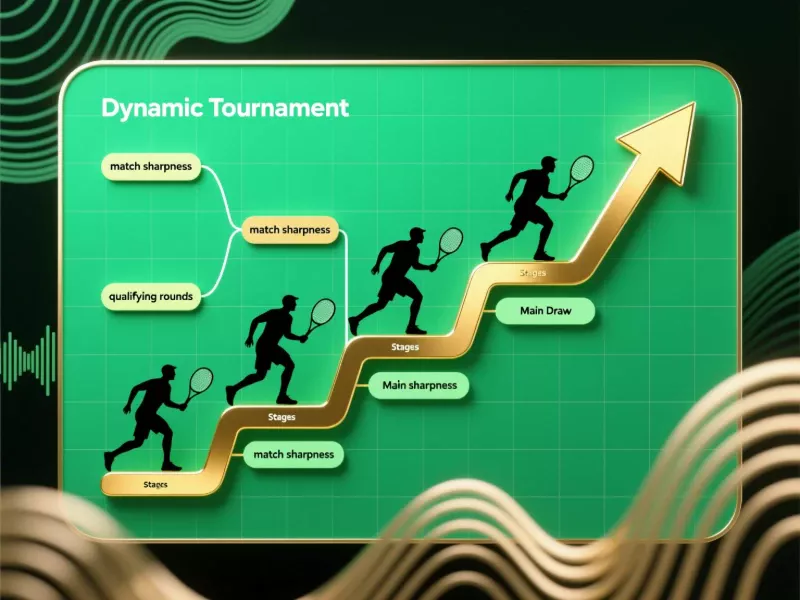
Qualifiers are systematically undervalued by betting markets. These are players who fought through three qualifying matches to reach the main draw. They have match rhythm, confidence from winning three straight, and nothing to lose. Yet the market prices them primarily on ranking, which underweights the advantages they bring.
The match readiness factor is enormous in tennis. A qualifier has played three competitive matches in the last few days. Their timing is sharp. They’re seeing the ball well. Their movement is dialed in. Compare this to their main draw opponent who might not have played a competitive match in a week or more. The automatic entry received a bye through qualifying and comes in cold.
This advantage is most pronounced in the first round of the main draw. The qualifier is at peak sharpness while their opponent is still finding form. By the second or third round, everyone has match rhythm and the qualifier’s advantage diminishes. Focus your qualifier-based bets on first-round main draw matches.
Not all qualifiers are equal. A qualifier who dominated their three qualifying matches, winning 6-2, 6-3 in each, brings serious momentum. A qualifier who scraped through 7-6, 7-6 in three tight matches might be mentally and physically spent. Check qualifying results and scorelines before betting qualifiers.
Challenger tour dominance is a signal. If a qualifier has been crushing the Challenger tour, the level just below ATP, and qualified easily, they might be playing above their ranking. They’re on an upward trajectory. The market prices them on their ranking, which lags their actual current ability. These are prime candidates for qualifier-based bets.
Surface matters for qualifier value. On clay where matches are longer and more physically demanding, qualifiers are at a disadvantage by the time they reach the main draw. They’re coming in fatigued from three tough qualifying matches. On grass or fast hard courts where matches are shorter, the fatigue factor is less and the match sharpness advantage dominates.
Pairing the qualifier angle with other edges creates powerful bets. A qualifier with a big serve facing an opponent with weak return statistics, both on grass, stacks multiple advantages. The qualifier is match sharp, the matchup favors their style, and the surface amplifies their strength. These compound edges are where big value exists.
The market systematically underprices qualifiers because algorithms weight ranking heavily. A player ranked 120 facing a player ranked 40 gets auto-priced as an underdog regardless of context. The algorithm doesn’t account for the qualifier being match-sharp while the ranked 40 player is rusty. This creates exploitable patterns.
Tournament type influences qualifier value. At Grand Slams and Masters 1000 events, even the automatic entries are highly motivated and prepared. Qualifier advantages shrink. At ATP 250 events where top players sometimes show up unmotivated or under-prepared, qualifier advantages are larger. Focus on smaller tournaments for qualifier-based betting.
Historical data on specific players matters. Some players consistently perform well immediately after qualifying. Others tend to be spent and lose in the first round despite qualifying. Track this data for players you follow regularly. If Player A has made the quarterfinals twice after qualifying but Player B always loses in the first round after qualifying, treat them differently even if both are qualifiers.
The Statistical Edge System

The statistical edge system relies on identifying market inefficiencies through data analysis. You’re building models, tracking metrics, and finding situations where your calculated probabilities diverge from the implied probabilities in the betting lines.
Start by compiling comprehensive data on players you follow. Surface-specific win rates, hold percentages, break percentages, first serve percentages, aces per match, double faults per match, unforced errors per match. The data is freely available from ATP and WTA websites, Tennis Abstract, and various other sources. The competitive advantage comes from organizing it systematically and using it better than the market.
Expected value calculations formalize your betting process. For every potential bet, calculate the EV. If you bet $100 on a player at +200 odds and you assess their true winning probability at 40 percent, your EV is: (0.40 × $200) – (0.60 × $100) = $80 – $60 = +$20. Positive EV bets make money long-term even when individual bets lose. Only bet when EV is clearly positive.
Building a basic prediction model doesn’t require advanced mathematics. Start with Elo ratings, which measure relative player strength and update based on match results. Surface-specific Elo ratings are better than overall Elo. Add adjustments for recent form, head-to-head records, and surface specialization. Your model doesn’t need to be perfect. It just needs to be better than the market’s model often enough to generate profit.
Closing line value is the ultimate test of betting skill. CLV compares the odds you got when you placed your bet to the odds when the match starts. If you consistently beat the closing line, you’re identifying value before the market fully adjusts. Track your CLV religiously. Positive CLV over large samples correlates with long-term profitability even if you’re losing bets in the short term.
Regression analysis identifies which variables actually matter for predicting match outcomes. Maybe you think recent form is crucial, but regression reveals it has minimal predictive power compared to surface-specific head-to-head records. Let the data tell you what matters rather than relying on intuition or conventional wisdom.
The challenge with statistical systems is avoiding overfitting. You can find patterns in any dataset if you torture the data enough. A model that perfectly explains past results might have zero predictive power for future matches because it’s fit to noise rather than signal. Use out-of-sample testing. Build your model on 2023 data, then test it on 2024 data. If it still works, the patterns are real. If it fails, you overfit.
Market efficiency varies by tournament tier. Your statistical edge is larger in ATP 250 events, Challenger tours, and early rounds of all tournaments. These matches have softer lines. Grand Slam finals and Masters 1000 semifinals are incredibly efficient. Your statistical model needs to be genuinely superior to beat those markets.
Live betting data creates real-time edges. If you’re tracking live statistics during matches, you might notice a player’s first serve percentage has dropped twenty points below average. Your model says this predicts increased break probability. If the live odds haven’t fully adjusted yet, you’ve found value. The window is small because markets adjust quickly, but it exists.
Combine quantitative analysis with qualitative assessment. Models are powerful but they can’t capture everything. A model doesn’t know a player just changed coaches. It doesn’t know a player is dealing with personal issues affecting their focus. Layer your statistical edge on top of qualitative information about player situations to maximize accuracy.
Bankroll Management and Psychological Discipline
No betting system works without proper bankroll management and psychological discipline. You can have the best analysis in the world but if you’re betting too much per play or tilting after losses, you’ll go broke.
The unit system is foundational. Define one unit as one to two percent of your total bankroll. If your bankroll is $5,000, one unit is $50 to $100. Bet in units rather than dollar amounts. This scales your risk appropriately as your bankroll grows or shrinks. Win consistently and your unit size increases. Lose and your unit size decreases automatically, protecting you from ruin.
Flat betting removes decisions about bet sizing. Every bet is one unit regardless of confidence level. This is the safest approach because it eliminates the temptation to overbet when you’re feeling good or chase losses when you’re stuck. It’s boring but it works. Most long-term profitable bettors use flat betting or very minor variations.
Confidence-based scaling means increasing to 1.5 or 2 units when multiple edges align. Maybe you’ve identified a surface specialist on their best surface against a poor matchup in good form with favorable weather. That’s 2 units. Normal bets remain 1 unit. Be honest about your edge. If you’re scaling up more than twenty percent of your bets, you’re overconfident and likely not actually identifying unusually strong edges.
Never bet more than three to five percent of your bankroll on any single bet. Even your best bet, where everything aligns perfectly, caps at five percent maximum. This protects against catastrophic losses from single bets. Variance happens. Upsets happen. No bet is a sure thing, and sizing too aggressively on any individual bet creates ruin risk.
Loss limits prevent tilt and emotional betting. Set a daily or weekly loss limit. Maybe you’ll stop betting if you’re down five units in a day or fifteen units in a week. When you hit the limit, step away. Come back tomorrow or next week with a clear head. Don’t chase losses. Don’t try to get even in one dramatic bet. That’s how bankrolls die.
Record everything obsessively. Date, player, tournament, surface, bet type, odds, stake, result. Export this to a spreadsheet monthly and analyze it. Where are you profitable? Where are you losing? What patterns emerge? Maybe you’re crushing clay court bets but bleeding money on grass. Adjust accordingly. You can’t improve what you don’t measure.
Variance is real and brutal. You’ll have losing weeks and months even with perfect process. A ten-bet losing streak is entirely normal over large samples. Don’t change your system based on short-term results. Evaluate your process over hundreds of bets, not dozens. If your process is sound and your CLV is positive, trust it through the downswings.
Separate betting bankroll from life expenses. Never bet with money you need for rent, food, or bills. Betting bankroll should be completely separate funds that you can afford to lose. This separation keeps you rational. When you’re betting with money you actually need, every loss creates stress and forces bad decisions.
Take breaks regularly. Even if you’re winning, step away for a week or two occasionally. Come back fresh with perspective. Tennis runs year-round so there’s no off-season, which means you can grind continuously. But continuous grinding leads to burnout, mistakes, and poor decision-making. Scheduled breaks maintain psychological sharpness.
The psychological aspect of profitable betting is managing emotions through inevitable variance. You will lose bets you should have won. You will win bets you probably should have lost. Neither validates nor invalidates your process. The only thing that matters is whether you’re making +EV decisions consistently. Results in the short term are noise. Process executed properly over large samples is signal. Stay focused on process and let results take care of themselves.
See also: bet-tennis – tips and analysis for tennis betting.
See also: Tennis Court Surfaces Betting Strategy – adapt your strategy to each surface.
